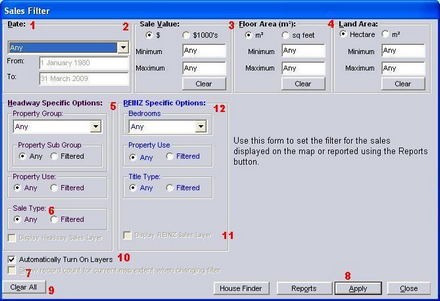
The Sales Filter form, generated by the Sales Icon on the toolbar allows you to produce various reports, based on set criteria.
| 1 | Date - choose from the drop down box or set Custom dates. |
| 2 | Sale Value - set Minimum and Maximum Values |
| 3 | Floor Area - looking for dwellings of specific floor areas |
| 4 | Land Area - filter Sales on specific land areas |
| 5 | Property Types and Uses - enables search for Property Types to be honed - also using sub-groups. |
| 6 | Sale Type - to identify true market sales |
| 7 | Record count shows the number of sales meeting the criteria on your current map extents |
| 8 | Apply will show the sales on the map based on the filter criteria |
| 9 | Clear All will clear all Filters |
| 10 | Automatically Turn on Layers - will enable you to manipulate visibility of Sales layers from this form |
| 11 | Options to turn REINZ or Headway Layers on/off when 10 has been unticked. |
| 12 | REINZ specific Options - REINZ login required to geocode, filter and report on REINZ sales - contact Custom Software for enquiries |
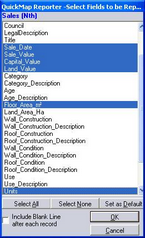
The Reports button
From the QuickMap Reporter, click to select fields to report on (blue) then OK. To deselect a field, click so that the field is no longer highlighted blue.
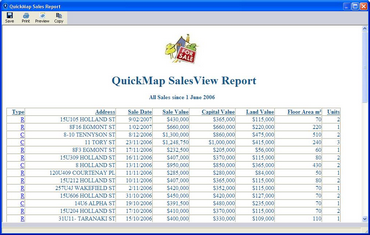
You can click any underlined hyperlink on the left hand side of the report to link to the detailed sales report for that property. The Copy button allows the Report to be pasted into a spreadsheet.
Apply your own Logo to the SalesView Report
From within QuickMap, Select Tools > Options > Choose Report Logo and locate the jpeg file for your organisation’s logo.
![]() sp
sp