
Using the Sales Filter Form with Quickmap Salesview
The Sales Filter form, generated by the Sales Icon on the toolbar, allows you to produce various reports based on set criteria.
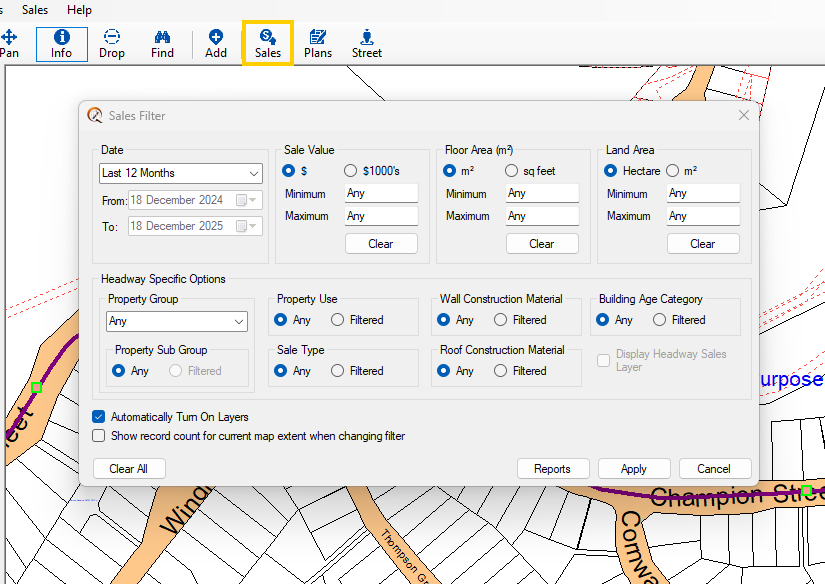
- Date: Choose from the drop-down box or set custom dates.
- Sale Value: Set minimum and maximum values.
- Floor Area: Filter for dwellings of specific floor areas.
- Land Area: Filter sales based on specific land areas.
- Headway Specific Options: Enables search for property types, including sub-groups.
- Sale Type: Identify true market sales.
- Record Count: Shows the number of sales meeting the criteria on your current map extents.
- Apply: Displays the sales on the map based on the filter criteria.
- Clear All: Clears all filters.
- Automatically Turn on Layers: Enables manipulation of the visibility of sales layers from this form.
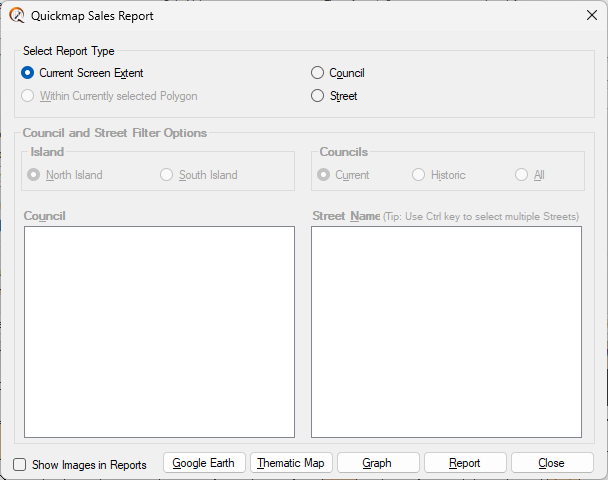
Defining your sales area:
Once you have selected your filters click Apply then Reports. In this next field you can choose to report from: your Current Screen Extent, within your Currently selected polygon, Council, or Street.
All sales data will be shown by default. The Sales Filter enables you to narrow down records according to your needs.
From the Filter form, it is also possible to access other tools , such as:
- View the Sales in Google Earth
- Generate a Thematic Map (coloring parcels based on Sale Price)
- Report on Sales by Road
- Generate a detailed Sales Report based on the Filter and current screen extent
The Reports button
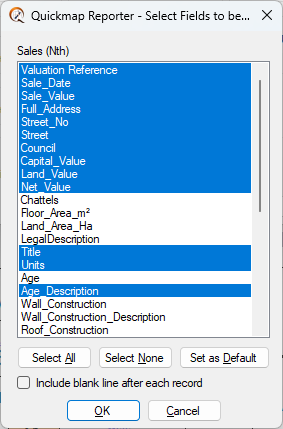
From the Quickmap Reporter, click to select fields to report on (blue) then OK. To deselect a field, click so that the field is no longer highlighted blue.
Apply your own Logo to the SalesView Report:
From within Quickmap, Select Tools > Options > Choose Report Logo and locate the jpeg file for your organisation’s logo