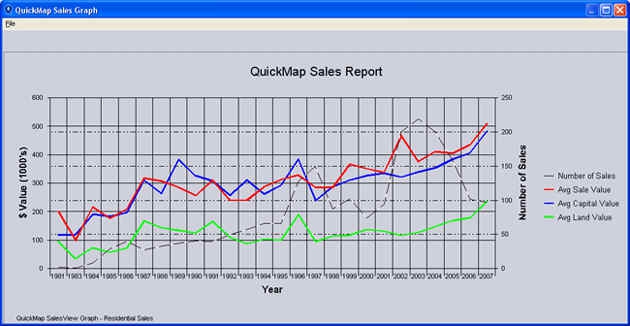
The QuickMap Sales Report Graph allows you to graph the average sales price, Capital Value and Number of Sales over time. A Real Estate agent would use this graph to help them do a market appraisal of what a property should sell for, and manage client expectations of sale price.
A property developer can use this tool to determine a properties current value, and assist in predicting future trends. Eliminate opinion see what is actually is happening.
The above graph shows the average residential sale price in red, and average Capital Value (CV) in blue. You can see that
- Properties are selling $15,000.00 more than their CV
- Significantly less properties have sold in the past year
- Average Sales price is trending towards Average Capital Value indicating properties are dropping in price

